
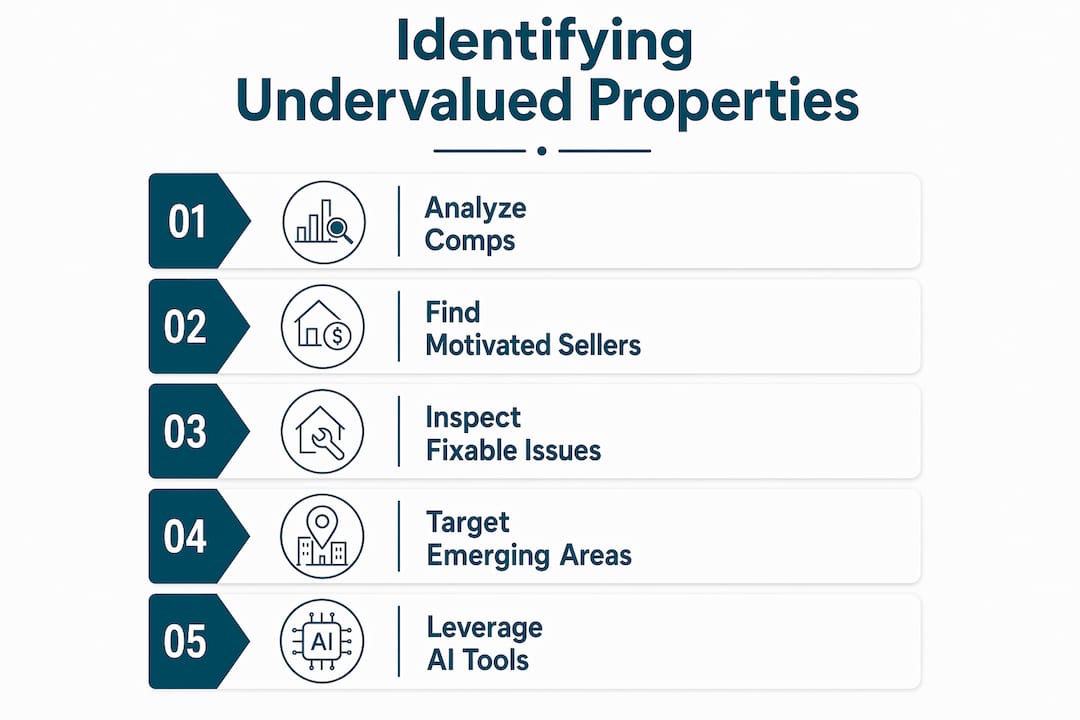
The fastest way to identify undervalued investment properties is to combine three things most investors treat as separate: comparable sales analysis, motivated seller detection, and AI-driven pricing anomaly tools. A property is undervalued when its current asking price falls below what the market data, income potential, or replacement cost would justify. That gap is where your profit lives.
Here is what that looks like in practice:
- Pull recent comparable sales (not active listings) within a half-mile radius and calculate price per square foot
- Screen public records for tax delinquency, liens, code violations, and pre-foreclosure notices
- Flag listings that have sat on the market longer than the local median days on market
- Run financial metrics: cap rate, gross rent multiplier (GRM), and cash-on-cash return against your target thresholds
- Use AI-powered platforms like HouseCanary or DealWorthIt to screen for pricing anomalies at scale
- Check zoning maps and infrastructure project announcements for neighborhoods ahead of appreciation
- Build relationships with local agents, contractors, and landlords for off-market leads before they go public
The investors who consistently win do not rely on any single method. They run all of these in parallel, so the deal that slips past one filter gets caught by another.
1. How comparable sales reveal what a property is actually worth
Comparable sales, or "comps," are the foundation of any honest valuation. Active listings tell you what sellers hope to get. Closed sales tell you what buyers actually paid. That distinction alone filters out a lot of wishful pricing.

When selecting comps, prioritize properties sold within the last 90 days, within a half-mile of the subject property, and within 20% of its square footage. Condition and age matter too. A 1,200-square-foot ranch that sold six months ago in a different school district is a weak comp, no matter how close it looks on a map.
The metrics to calculate:
- Price per square foot: divide the sale price by finished square footage; compare across five or more comps
- Adjusted sale price: add or subtract value for differences in bedrooms, bathrooms, garage, and lot size
- Sales-to-list ratio: a ratio below 95% in a given area signals that sellers are routinely accepting discounts
- Cap rate: net operating income divided by purchase price; a higher cap rate relative to local averages suggests underpricing on income properties
- Gross rent multiplier: purchase price divided by annual gross rent; lower GRM relative to comps means more income per dollar spent
For data, county assessor records, the MLS (accessed through a licensed agent), and public deed filings are your primary sources. Cross-referencing two or three sources catches data errors that skew your numbers.
2. How to spot motivated sellers before the market does
Motivated sellers are the single most reliable source of below-market deals. Their urgency creates pricing flexibility that a well-positioned seller simply will not offer. The key is finding them before a competing investor does.

The clearest signals of financial or legal distress include tax delinquency, liens, and pre-foreclosure notices. A homeowner who has not paid property taxes is already under pressure. One facing a contractor's lien cannot sell without resolving it. A pre-foreclosure means the clock is running, sometimes as short as 30 days before auction in certain states.
Where to find these lists:
- County tax office: tax-delinquency rolls are public record and often free
- County courthouse: pre-foreclosure and lis pendens filings are posted, sometimes on a physical bulletin board
- Code enforcement records: properties cited for violations often belong to absentee or overwhelmed owners
- Probate court filings: heirs inheriting properties they do not want to manage are frequently motivated sellers
Tax-delinquency lists are particularly productive in high-volume urban markets, where the volume of distressed owners creates real deal flow. The negotiation leverage is real: a seller trying to avoid a foreclosure auction, clear a lien, or settle an estate has a concrete reason to accept a discount. Your offer solves their problem, which changes the entire dynamic of the conversation.
3. Finding value in properties with cosmetic or fixable issues
Cosmetic problems are the investor's best friend, because they scare off retail buyers while leaving the underlying asset intact. A dated kitchen, worn carpet, peeling paint, and overgrown landscaping all reduce a listing's appeal without touching its structural value.
The critical skill is separating cosmetic from structural. Cosmetic fixes, think paint, flooring, fixtures, and landscaping, typically cost a fraction of what they add in resale or rental value. Structural issues, a failing foundation, a roof at end of life, knob-and-tube wiring, or a compromised HVAC system, can erase your margin entirely.
Listing language is a useful early filter. Terms like "good bones" or "hidden gem" generally signal a structurally sound property with cosmetic needs. "As-is" is a different story: it means the seller will not make repairs, and you inherit whatever the inspection reveals. "Needs work" often points to systems near end of life, not just a paint job.
Pro Tip: Before making an offer on a fixer, get a contractor walkthrough, not just a home inspection. Inspectors document what they see; experienced contractors price what it costs to fix. That number is what actually determines your ROI.
A quick renovation cost estimate should cover roof, HVAC, plumbing, electrical, flooring, and kitchen and bath updates. If those five categories together exceed 20% of your projected after-repair value (ARV), run the numbers carefully before proceeding.
4. Why emerging neighborhoods are where the real appreciation happens
Buying in a neighborhood that has already appreciated is buying someone else's profit. The investors who build wealth consistently get in before the price move, not after it. That requires reading signals that most buyers ignore.
Infrastructure is the most reliable leading indicator. A new light rail stop, a highway interchange, or a major employer relocating to an area tends to lift surrounding property values over the following 24–48 months. Transitional neighborhoods driven by infrastructure projects and zoning changes consistently contain undervalued properties that appreciate as those drivers materialize.
Key signals to watch:
- New transit lines or bus rapid transit corridors announced by the city
- Zoning changes from single-family to mixed-use or higher-density residential
- Anchor commercial tenants (grocery stores, national retailers) signing leases in previously vacant strips
- Rising permit activity for new construction or major renovations
- Demographic shifts toward younger renters or first-time buyers priced out of adjacent neighborhoods
GIS mapping tools, including publicly available layers from city planning departments, let you overlay these data points spatially. When three or four signals cluster in the same half-mile radius, that is a micro-market worth investigating at the property level.
5. What long days on market actually tell you about a listing
A property that has sat on the market well past the local median is not necessarily a bad property. It is often a mispriced or poorly marketed one, and that distinction creates opportunity.
When a listing expires or gets withdrawn without a sale, the seller has already absorbed months of carrying costs and emotional fatigue. They are frequently more open to negotiation than they were on day one. Poorly marketed properties with blurry photos, vague descriptions, or outdated listings are routinely overlooked by buyers who never get past the thumbnail, yet the underlying property may be entirely sound.
What to look for:
- Days on market exceeding 150% of the local median (pull this from MLS data or a local agent)
- Listing photos that are dark, cluttered, or taken with a wide-angle lens that distorts room size
- Descriptions that list square footage and bedrooms but say nothing about condition or updates
- Price reductions of 5% or more, especially multiple reductions over a short period
- Expired and relisted properties, which reset the days-on-market clock but carry the same underlying issues
Reaching out to the listing agent on a stale property is often more productive than bidding on a fresh one. The seller's motivation has usually increased, and the competition has usually thinned.
6. How auctions, foreclosures, and off-market deals give you a pricing edge
Nontraditional sales channels exist precisely because the standard MLS process does not serve every seller. Distressed owners, banks holding REOs, and wholesalers all have reasons to move properties quickly, and that urgency translates directly into price.
The main channels:
- Pre-foreclosures: the owner still holds title but has missed payments; approach them before the bank takes over
- REOs (real estate owned): bank-owned properties after foreclosure, often sold at discount to clear the balance sheet
- Short sales: the lender agrees to accept less than the outstanding mortgage balance; slower process but real discounts
- Sheriff and court auctions: cash-only, often no inspection period, but prices can run well below market
- Wholesale deals: investors who control a property under contract and assign it to a buyer for a fee
Off-market platforms connect investors directly with distressed sellers and wholesale opportunities before properties hit public listings, often at prices 20–40% below market. The reduced competition alone justifies the extra sourcing effort. You are not bidding against a dozen other buyers; you are having a direct conversation.
The main risk in distressed channels is buying a property with unknown capital expenditure exposure. A courthouse auction that prohibits inspection can hide a failed septic system or a condemned roof. Budget a contingency reserve, and never let the discount override the due diligence.
7. Why your local network is still your best deal source
Data platforms surface what is already visible. Your network surfaces what is not. The two work together, but the deals that never hit any platform at all come exclusively from relationships.
Contractors know which homeowners are getting ready to sell because they just finished a project or because the owner mentioned it. Landlords who have managed a property for 20 years sometimes decide to exit after a difficult tenant, and they would rather sell quietly to someone they trust than list publicly. Local investors who are liquidating part of a portfolio will often offer a deal to a known buyer before calling a broker.
How to build that pipeline:
- Attend local real estate investor association (REIA) meetings monthly
- Build a short list of five to ten agents who specialize in investment properties and call them regularly
- Develop relationships with two or three contractors who work across multiple neighborhoods
- Join neighborhood Facebook groups and community boards where property owners post informally
- Send direct mail to owners of properties that match your criteria, even if nothing is listed
The qualitative intelligence from a network, knowing that a specific owner is burned out, that a building has deferred maintenance the photos do not show, or that a neighborhood is about to get a new anchor tenant, is the kind of context that makes a data-driven analysis actually useful.
8. How AI tools like HouseCanary and DealWorthIt change the screening process
Manual property screening has a hard ceiling: you can only evaluate so many deals per week. AI-powered platforms remove that ceiling by running mass appraisals across entire markets in the time it takes to review a single listing.
Predictive analytics platforms achieve close to 94% accuracy in identifying pricing anomalies by processing millions of transactions and flagging properties where the listing price falls significantly below the predicted value. That is not a marginal improvement over manual analysis. It is a different category of capability.
HouseCanary provides property valuations, CMAs, market forecasts, and AI-driven analytics built for investors, brokers, lenders, and appraisers. It pulls from a deep dataset of residential sales and applies machine learning to generate valuation confidence scores alongside the estimate itself.
DealWorthIt analyzes both on-market and off-market properties across single-family, multifamily, and commercial asset classes. It surfaces under-market-value deals by quickly processing sales history, ownership records, and rental trends, which is particularly useful for investors who work across multiple property types.
Beyond valuation, AI-powered renovation cost tools analyze property images and local labor rates to forecast repair expenses and expected ROI, helping investors avoid properties that are cheap for structural reasons rather than market inefficiency. AI models also incorporate neighborhood-level data including school ratings, crime statistics, and employment trends to identify micro-markets where values lag behind surrounding areas despite similar fundamentals.
The most effective approach combines AI screening with investor judgment. The platform surfaces the candidates; you apply local knowledge and boots-on-the-ground assessment to close the deal.
9. How zoning laws can unlock hidden property value
Zoning is one of the most underused tools in a property investor's analysis. A parcel zoned for single-family use today may be eligible for rezoning to multifamily or mixed-use, and that change alone can multiply the land's value without a single physical improvement.
Start by pulling the current zoning designation from the local planning department's GIS portal. Then check whether the property sits within a designated overlay district, opportunity zone, or redevelopment corridor. These designations often signal that the municipality is actively encouraging higher-density or commercial development in that area.
Variance and rezoning applications filed by neighboring properties are public record. If three parcels on the same block have applied for density increases, the fourth is likely to follow, and buying it before the trend becomes obvious is the play. Properties that are legally conforming but physically underbuilt for their zoning, a single-family home on a lot zoned for four units, for example, carry embedded value that the current use does not reflect.
10. What property tax assessments reveal about pricing gaps
County tax assessments and market values diverge constantly, and that gap is a useful signal. When a property's assessed value is substantially lower than comparable sales suggest it should be, it can indicate that the owner has held the property for a long time without improvements, that the assessor's data is outdated, or that the market has moved faster than the assessment cycle.
Pull the assessment history from the county assessor's website. Look for properties where the assessed value has not increased in several years despite rising neighborhood comps. That stagnation sometimes reflects an owner who has not engaged with the market and may not realize what their property is worth, or conversely, what a buyer would pay.
Assessment appeals are also informative. A property whose owner has successfully appealed the assessment downward may be priced below its actual market value, because the owner anchored their expectations to the lower assessed figure. Cross-referencing the assessment, the listing price, and recent comps in a single spreadsheet takes 20 minutes and can surface deals that no algorithm flags.
11. Using market trend data and economic indicators to time your entry
Property values do not move in isolation. Employment growth, population migration, interest rate cycles, and local permit activity all feed into where prices are headed. Investors who track these indicators get to act on trends before they show up in closed sale prices.
At the national level, Federal Reserve rate decisions directly affect mortgage affordability and therefore buyer demand. When rates rise sharply, seller price expectations often lag the market by 60–90 days, creating a window where asking prices have not yet adjusted to reduced buyer purchasing power.
At the local level, the metrics that matter most are:
- Job growth by sector: a single large employer adding 2,000 jobs in a mid-size market moves housing demand measurably
- Net migration data: Census Bureau and IRS migration data show which counties are gaining and losing population year over year
- Building permit volume: a surge in permits signals developer confidence; a drop signals the opposite
- Vacancy rates: rising residential vacancy in a submarket often precedes price softening, which creates buying opportunities
Combining national rate cycle awareness with local economic data gives you a two-layer filter: buy in markets where local fundamentals are strong and national conditions have temporarily suppressed prices.
12. How GIS mapping and real estate data platforms sharpen your analysis
GIS mapping turns abstract data into spatial patterns you can act on. When you overlay school district boundaries, flood zones, transit corridors, zoning designations, and recent sale prices on a single map, relationships emerge that a spreadsheet cannot show.
City and county planning departments publish GIS layers for free. Esri's ArcGIS platform and open-source tools like QGIS let you combine those public layers with your own property data. Plotting your target properties against planned infrastructure projects, for instance, can reveal which ones sit within the likely appreciation radius of a new transit stop.
On the data platform side, tools that aggregate MLS data, public records, and demographic information let you filter at the market level before drilling down to individual properties. Filtering by days on market, price per square foot relative to zip code median, and ownership duration in a single query surfaces a shortlist that would take days to build manually. The goal is not to replace site visits and local knowledge. It is to make sure you are spending your time on the properties that actually deserve a closer look.
Key Takeaways
Investors who consistently find undervalued properties combine comparable sales analysis, motivated seller detection, and AI-powered screening to surface deals before the broader market recognizes them.
| Point | Details |
|---|---|
| Lead with closed sales, not listings | Price per square foot from recent closed comps reveals true market value; active listings only show seller hope. |
| Motivated sellers are in public records | Tax delinquency, liens, code violations, and pre-foreclosure notices are free county records and your best source of discounted deals. |
| AI platforms screen at scale | Tools like HouseCanary and DealWorthIt flag pricing anomalies across entire markets, with accuracy near 94% on undervaluation detection. |
| Zoning and tax assessments hide value | A property underbuilt for its zoning or assessed well below recent comps often carries value the listing price does not reflect. |
| Off-market deals reduce competition | Off-market platforms source wholesale and distressed properties at prices 20–40% below market, where you negotiate without a bidding war. |
Work with local experts who know where the deals are
Finding undervalued properties takes more than a checklist. It takes local market knowledge, relationships with agents who see deals before they list, and the analytical depth to know when a number is real. Beamsrealtygroup brings all three to Virginia investors and homebuyers, with a track record of guiding clients to the right properties at the right price.
If you are ready to stop scrolling listings and start acquiring properties with real upside, connect with Beamsrealtygroup and put their market expertise to work for your next deal.