
Real estate appreciation is the increase in a property's value over time. It is one of the primary reasons people buy property as an investment, not just a place to live. Home appreciation is driven by location desirability, local economic growth, market demand, and the physical condition of the property itself. When you buy a home for $300,000 and it sells a decade later for $480,000, that $180,000 gain is appreciation at work.
Here is what shapes that gain:
- Location: Proximity to good schools, employment centers, and amenities consistently drives value upward.
- Market demand: When buyers outnumber available homes, prices climb.
- Economic conditions: Job growth, wage increases, and low unemployment pull more buyers into the market.
- Property condition: Well-maintained and updated homes attract stronger offers.
- Time: Appreciation compounds. Even modest annual gains add up significantly over 10–20 years.
Understanding how property value increases gives you a real edge, whether you are buying your first home or building a portfolio.
Table of Contents
- How appreciation and depreciation differ in real estate
- What actually drives real estate appreciation?
- How to calculate real estate appreciation
- What are typical home appreciation rates in the U.S.?
- Practical ways to increase your property's value
- How appreciation affects your investment returns
- Beamsrealtygroup brings local expertise to your appreciation strategy
- Key Takeaways
How appreciation and depreciation differ in real estate
Appreciation and depreciation are opposite forces, and both are real possibilities for any property. Appreciation means your home is worth more than you paid. Depreciation means the opposite: the market value has fallen below what you originally paid, or below a prior peak.
Depreciation does not always signal a permanent loss. A neighborhood hit by a factory closure may see values drop for several years, then recover as new employers move in. But in some cases, such as structural neglect or a region in long-term economic decline, depreciation can be lasting.
| Scenario | Appreciation or Depreciation | Common Cause |
|---|---|---|
| Home in a growing metro area | Appreciation | Job growth, population influx |
| Property near a new school or transit line | Appreciation | Infrastructure investment |
| Home in a shrinking rust-belt city | Depreciation | Population loss, employer exits |
| Neglected property with deferred maintenance | Depreciation | Physical deterioration |
| Home during a recession or rate spike | Temporary depreciation | Reduced buyer demand |
| Well-maintained home in a stable suburb | Steady appreciation | Consistent demand, limited supply |
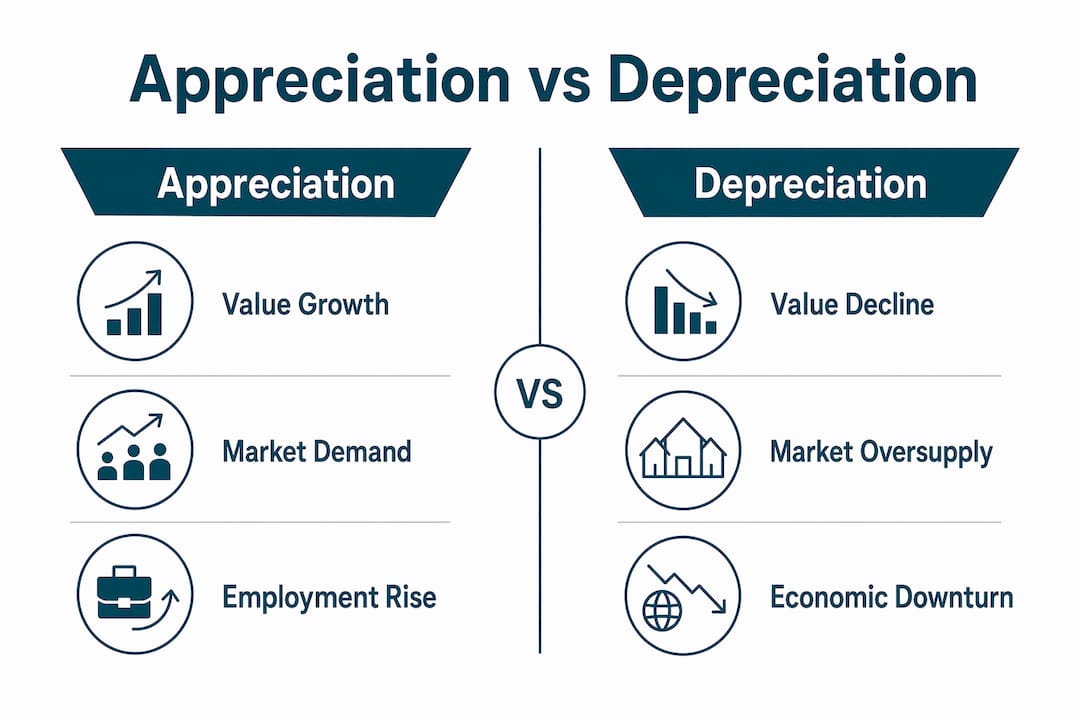
The key distinction for property owners: depreciation tied to market cycles is often temporary, while depreciation tied to location fundamentals or physical neglect tends to be harder to reverse.
What actually drives real estate appreciation?
Location remains the single most powerful factor. A home in a top-rated school district will almost always outperform a comparable home in a weaker district over a 10-year span. Walkability scores, access to transit, and proximity to job centers all feed into how buyers price a neighborhood.

Market supply and demand shape prices in the short and medium term. When inventory is tight and buyers are competing, sellers hold the leverage. When listings pile up and buyers pull back, prices soften. Watching active inventory levels in your target market tells you more about near-term price direction than almost any other single metric.
Economic drivers run deeper. Employment growth and diversification are among the most reliable indicators of sustained housing demand. Areas with a broad mix of industries, rather than dependence on a single employer or sector, tend to produce steadier appreciation over time. Interest rates also matter: when mortgage rates rise sharply, as they did in 2022 and 2023, affordability shrinks and price growth slows or reverses temporarily.
Property-level factors are within your control. Regular maintenance prevents value erosion. Strategic upgrades, particularly kitchens, bathrooms, and energy-efficient systems, can push a home above comparable listings in the same zip code.
- School district quality: Consistently one of the top buyer priorities in suburban markets.
- Neighborhood trajectory: A block improving through renovation signals rising values; one declining signals risk.
- Zoning and development: New commercial or transit projects nearby often precede price increases.
- Interest rate environment: Lower rates expand the buyer pool; higher rates compress it.
- Local inventory levels: Fewer than three months of supply typically favors sellers and pushes prices up.
How to calculate real estate appreciation
The core formula is straightforward. Subtract the original purchase price from the current market value, divide by the purchase price, then multiply by 100.
- Identify your purchase price. Use the actual amount paid, not the appraised value at the time.
- Determine the current market value. Use a recent appraisal, a comparative market analysis (CMA) from a licensed agent, or a credible automated valuation model.
- Apply the formula: [(Current Value − Purchase Price) ÷ Purchase Price] × 100 = Appreciation Percentage.
- Work through a real example. A home bought for $300,000 now worth $350,000 has appreciated 16.67%.
- Annualize the figure. Divide the total appreciation percentage by the number of years held. That same home held for five years appreciated at roughly 3.3% per year.
- Account for improvements. If you spent $20,000 on renovations, your true cost basis is $320,000. Recalculate from there to get a realistic return figure.
- Use the FHFA HPI Calculator for a data-driven benchmark. The Federal Housing Finance Agency publishes a House Price Index calculator that estimates appreciation for any U.S. metro area over a chosen time period.
Pro Tip: Annualized appreciation is more useful than total appreciation when comparing properties held for different lengths of time. A home that gained 40% over 20 years underperformed one that gained 25% over five years.
What are typical home appreciation rates in the U.S.?
U.S. home values have generally increased over time, though rates vary widely by region and market conditions. The 2008 crash wiped out years of gains in many markets. The 2020–2022 period included years of unusually strong appreciation in many markets. Neither extreme is the norm.
Stat to know: On a $200,000 home, a 4.5% annual appreciation rate translates to roughly $9,100 in added value per year, according to Zillow Home Value Index data.
As of mid-2026, mortgage rates averaged around 6.3%, and national home price growth was approximately 1.2%, indicating slower appreciation compared to historical averages.
Regional variation is dramatic. Sun Belt metros like Austin and Phoenix saw explosive appreciation from 2020–2022, then gave back a portion of those gains. Midwest markets such as Columbus, Indianapolis, and Kansas City have delivered quieter but more consistent appreciation over the past decade. Coastal markets like San Francisco and New York are heavily sensitive to tech-sector employment and interest rate cycles.
The practical takeaway: national averages are a starting point, not a forecast for your specific market. A 1.2% national figure means nothing if you are buying in a neighborhood where inventory is at a 10-year low.
Practical ways to increase your property's value
Not all appreciation is passive. Forced appreciation, the kind you create through deliberate improvements, can add value independent of what the broader market is doing.
- Kitchen and bathroom renovations consistently rank among the highest-return projects. A mid-range kitchen remodel typically recovers a significant portion of its cost at resale, and updated bathrooms signal move-in readiness to buyers.
- Energy efficiency upgrades such as new windows, insulation, and HVAC systems lower operating costs and appeal to an increasingly cost-conscious buyer pool.
- Curb appeal: First impressions drive offers. Fresh paint, landscaping, and a clean driveway cost relatively little but affect how buyers perceive the entire property.
- Deferred maintenance: Fixing what is broken before listing, leaky roofs, aging electrical panels, cracked foundations, removes the buyer's negotiating leverage and protects your asking price.
- ADU additions: In markets where zoning allows, adding an accessory dwelling unit can meaningfully increase both appraised value and rental income potential.
Regular maintenance and strategic improvements increase market attractiveness and can accelerate appreciation beyond what the surrounding market delivers on its own.
Pro Tip: Time major renovations six to twelve months before you plan to list. Improvements done too far in advance can show wear by listing day; improvements rushed right before listing can look unfinished to a sharp buyer's agent.
How appreciation affects your investment returns
Appreciation builds equity, and equity is the engine of long-term real estate wealth. Every dollar of appreciation increases your net worth without requiring additional capital. On a leveraged purchase, the effect is amplified: a 5% gain on a $400,000 property bought with a $80,000 down payment represents a 25% return on your actual cash invested.

Market cycle timing matters, but not in the way most investors think. Long-term holding in quality locations generally outperforms attempts to buy at the bottom and sell at the peak. Investors who held through the 2008 crash and stayed in fundamentally strong markets recovered fully and went on to significant gains. Those who sold at the trough locked in permanent losses.
Leading indicators give you an edge on timing without requiring you to predict the future. Building permits and mortgage applications signal near-future market shifts 1–6 months ahead. Median home prices, by contrast, are a lagging indicator: they confirm what already happened. Watching permit activity in a target market tells you whether supply is about to increase before that supply shows up in listings.
The risks are real. Depreciation phases do occur, and overleveraged investors who cannot weather a down cycle are forced to sell at the worst time. Diversifying across markets and maintaining adequate cash reserves are the two most reliable buffers against a temporary downturn becoming a permanent loss.
Beamsrealtygroup brings local expertise to your appreciation strategy
Knowing how appreciation works is one thing. Knowing which specific Virginia neighborhoods are positioned to outperform the next five years takes a different kind of knowledge.
Beamsrealtygroup gives buyers and investors in Virginia exactly that: deep local market knowledge paired with the kind of direct, clear communication that most agents skip. The team tracks inventory levels, employment trends, and neighborhood trajectories across Virginia markets, so clients make decisions based on real data rather than national headlines. Whether you are buying a first home, selling at the right moment in the cycle, or building a rental portfolio, Beamsrealtygroup's personalized approach means you are not getting a generic playbook. You are getting guidance built around your specific goals and timeline. Visit Beamsrealtygroup to connect with an agent who knows your market.
Key Takeaways
Real estate appreciation builds long-term wealth through compounding value gains driven by location, employment growth, and strategic property improvements.
| Point | Details |
|---|---|
| U.S. average appreciation rate | Homes have appreciated at approximately 4.5% annually, with wide regional variation. |
| 2026 market conditions | Mortgage rates averaged 6.3% and national home price growth was about 1.2%, reflecting a slower cycle. |
| Appreciation calculation | Subtract purchase price from current value, divide by purchase price, multiply by 100 for the percentage. |
| Forced vs. market appreciation | Strategic renovations like kitchen upgrades and energy improvements add value beyond passive market gains. |
| Beamsrealtygroup | Provides Virginia buyers and investors with local market expertise and personalized guidance to maximize appreciation potential. |