
Leveraged real estate investing means using borrowed money to control a property worth more than your cash investment. Put down $100,000 on a $500,000 home, and you control the full asset while the lender carries the other $400,000. When the property rises 10% in value, your $50,000 gain represents a 50% return on equity — not 10%. That amplification works in reverse too.
Three things Virginia buyers and sellers should know upfront:
- Leverage amplifies both gains and losses. A market dip that barely stings an all-cash buyer can wipe out a heavily leveraged investor's equity.
- Use clear metrics before you commit. The debt-service coverage ratio (DSCR) and the cap rate vs. loan constant comparison are the two numbers that separate a sound deal from a risky one.
- Plan for a 5+ year hold. Industry guidance consistently points to longer time horizons as the primary guardrail for leveraged strategies. Beamsrealtygroup works with Virginia clients to model both leveraged and all-cash scenarios before any offer goes in.
Table of Contents
- What is leveraged real estate investing, and how does the math work?
- Why investors use leverage: four channels of return
- What are the real risks of leveraged real estate?
- How long should you hold a leveraged property?
- How do you evaluate whether a leveraged deal makes sense?
- How Virginia buyers and sellers should apply these concepts
- Key Takeaways
- The leverage conversation most agents skip
- Ready to model your next Virginia deal with a local expert?
- Useful sources and further reading
What is leveraged real estate investing, and how does the math work?
Leverage in real estate rests on four core metrics. Loan-to-value (LTV) is the loan amount divided by the property's value — an 80% LTV means you borrowed $400,000 on a $500,000 property. The cap rate is net operating income (NOI) divided by purchase price, measuring a property's return with no debt. The loan constant is annual debt service divided by the loan amount. The cash-on-cash return is annual pre-tax cash flow divided by total cash invested. DSCR is NOI divided by annual debt service.
All-cash vs. 80% LTV: a side-by-side example
| Scenario | Purchase Price | Cash Invested | NOI (annual) | Debt Service | Net Cash Flow | Cash-on-Cash Return |
|---|---|---|---|---|---|---|
| All-cash | $300,000 | $300,000 | $9,000 | — | $9,000 | 3% |
| 80% LTV mortgage | $300,000 | $60,000 | $9,000 | $16,500 | $2,400 | 4% |
In the leveraged scenario, the investor controls a $300,000 asset with only $60,000 down. If the property appreciates, the gain lands on a smaller cash investment, significantly amplifying the equity return versus the all-cash buyer. The trade-off: net cash flow drops to $2,400 because debt service consumes most of the NOI.
The cap rate vs. loan constant test: When the cap rate exceeds the loan constant, leverage is accretive — debt boosts your returns. When the loan constant exceeds the cap rate, every dollar of debt drains equity rather than building it.
A $6,000 annual cash flow on $75,000 invested (down payment plus closing costs) equals an 8% cash-on-cash return. That figure is what you actually pocket — not the headline appreciation number.
Why investors use leverage: four channels of return
Leveraged property investment generates returns through four distinct paths, not just appreciation.
- Cash flow: Rent minus operating expenses and debt service. Thin at high LTV, but it compounds over time.
- Principal paydown: Each mortgage payment reduces your loan balance. Tenants, in effect, build your equity.
- Appreciation: Property value growth applied to the full asset value, not just your equity stake — the amplification effect shown in the example above.
- Tax benefits: The mortgage interest deduction and depreciation (residential property depreciates over 27.5 years under IRS rules) can meaningfully reduce taxable income from rental properties.
The "other people's money" (OPM) principle is what makes leveraged investing attractive for portfolio growth. With $300,000 in capital, you can buy one property all-cash or control three $300,000 properties at 80% LTV, spreading appreciation exposure across multiple assets.
Pro Tip: Talk to a CPA before assuming depreciation and mortgage interest deductions will offset your tax bill. Passive activity loss rules and income thresholds can limit how much you deduct in a given year.

What are the real risks of leveraged real estate?
Leverage does not create risk — it concentrates it. Three scenarios show how quickly things can turn.
A single vacancy on a property with thin DSCR can flip positive cash flow to negative within one month. If rent covers $1,300 of a $1,400 mortgage payment with $100 to spare, one empty unit means you're writing a check every month. A rapid rate increase on variable-rate debt compounds the problem: even a modest rise on an adjustable-rate loan can add materially to debt service, potentially pushing a marginally positive deal into the red.
"When loan constants exceeded cap rates in the mid-2020s as interest rates rose sharply, many investors found themselves in negative leverage — paying more to service debt than the property earned on an unlevered basis."
A significant market correction can create a structural trap. Being underwater means you may need to bring cash to close on a sale, and refinancing is often impossible. That is why experienced investors often prefer lower LTV cushions rather than very high leverage, even when lenders offer more. The structural risks to watch: low cash reserves, LTV above 80%, variable-rate debt, and DSCR below 1.20.
How long should you hold a leveraged property?
Experts recommend a multi-year holding period as the baseline for leveraged real estate. The reasoning is straightforward: short holds expose you to market timing risk, while longer holds let compounding appreciation and principal paydown do the heavy lifting.
A conservative scenario on a $300,000 property at 3% annual appreciation illustrates the accumulation:
- Year 1: ~$9,000 appreciation + ~$3,000 principal paydown = ~$12,000 equity gain
- Year 3: Cumulative appreciation ~$27,000 + ~$9,500 principal paydown = ~$36,500 total equity built
- Year 5: Cumulative appreciation ~$46,000 + ~$16,500 principal paydown = ~$62,500 total equity built
Short-term bridge loans and hard-money financing (typically 12–36 month terms at higher rates) suit fix-and-flip strategies where the exit is a sale, not a hold. The risk profile is entirely different: you need to sell at a profit before the loan matures, with no compounding to bail you out if the market stalls.
How do you evaluate whether a leveraged deal makes sense?
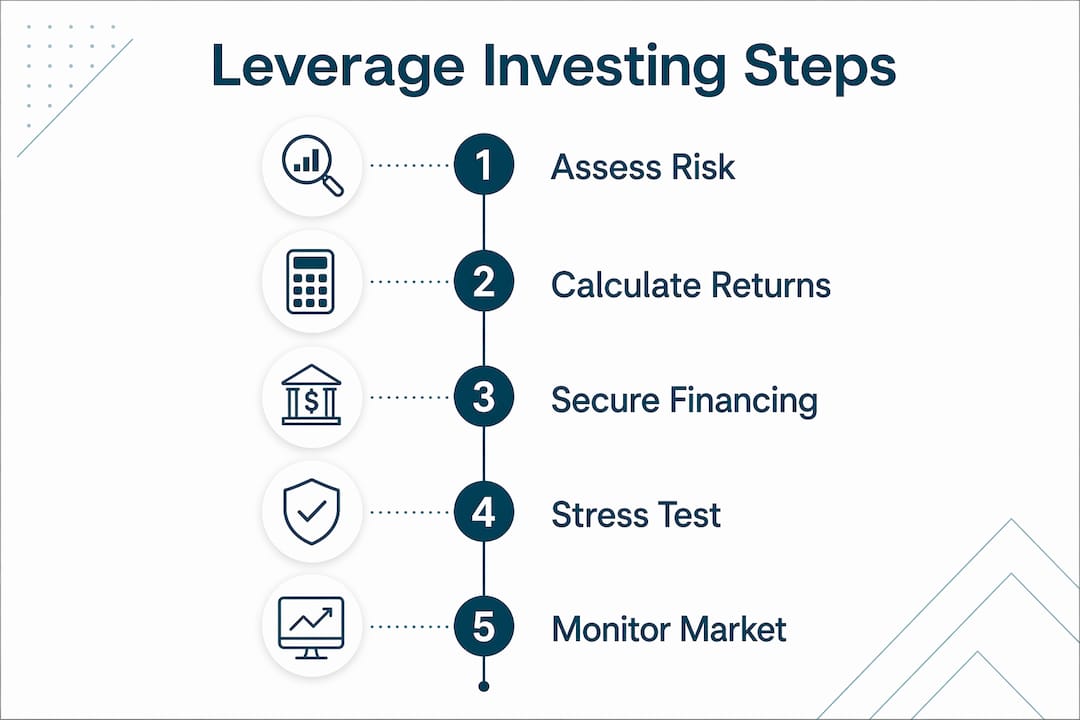
Run this checklist before committing to any leveraged purchase.
- Check the cap rate vs. loan constant. If the loan constant exceeds the cap rate, stop. The deal has negative leverage from day one.
- Calculate DSCR. Most commercial lenders require 1.20–1.25 minimum; target 1.25 or higher for a 25% cushion above debt service.
- Confirm cash reserves. Keep at least 6 months of mortgage payments per property in liquid reserves.
- Target LTV by strategy: 70–80% for growth-stage investors; 50–65% for stability at scale.
- Stress-test three scenarios before closing.
| Stress Scenario | Change Applied | Impact to Watch |
|---|---|---|
| Rent drop | Rents fall 10% | Does DSCR stay above 1.20? |
| Vacancy spike | Vacancy rises to 10% | Does cash flow stay positive? |
| Rate increase | Rate rises 2 percentage points | Does debt service exceed NOI? |
Use a DSCR calculator to run these scenarios before you sit across from a lender. If any one of the three stress tests breaks the deal, the LTV is too high or the reserves are too thin.
How Virginia buyers and sellers should apply these concepts
Virginia's real estate market spans high-demand Northern Virginia suburbs, Richmond's growing urban core, and coastal Hampton Roads — each with different rent-to-price ratios and vacancy trends. What works in Fairfax County may not pencil in Roanoke.
- Run local comps first. A Virginia agent can pull actual rent data and recent sales to ground your cap rate calculation in real numbers, not national averages.
- Get preapproval from a local lender. Conventional loans (typically requiring 20–25% down for investment properties), FHA loans (for owner-occupied purchases with as little as 3.5% down), VA loans (zero down for eligible veterans), and HELOCs are all available to Virginia buyers, each with different cost and term profiles.
- Confirm vacancy and rent trends by submarket. A 5% vacancy assumption that holds in Arlington may be optimistic in a smaller market.
- Build a 6-month reserves buffer per property before closing, not after.
Virginia does not impose a separate state income tax on mortgage interest deductions — those flow through federal returns. Depreciation benefits apply at the federal level regardless of where the property sits.
Pro Tip: Ask your lender for a full amortization schedule on day one. Seeing exactly how principal paydown accelerates in years 4–7 often changes how investors think about early exit strategies.
Key Takeaways
Leveraged real estate investing amplifies both gains and losses, and the difference between a profitable deal and a costly mistake usually comes down to three metrics: DSCR, the cap rate vs. loan constant comparison, and cash reserves.
| Point | Details |
|---|---|
| Core definition | Leverage uses borrowed money to control a property worth more than your cash investment, amplifying returns and losses. |
| 5+ year rule | Experts recommend holding leveraged properties five years or more to reduce timing risk and let principal paydown compound. |
| Key risk guardrails | Target DSCR ≥ 1.25, keep LTV at 70–80% for growth, and maintain 6 months of reserves per property. |
| Negative leverage warning | When the loan constant exceeds the cap rate, debt drains equity — run this check before every purchase. |
| Beamsrealtygroup next step | Work with a Beamsrealtygroup agent to model leveraged vs. all-cash scenarios using local Virginia comps and lender introductions. |
The leverage conversation most agents skip
The standard pitch for leverage focuses on amplified returns. What gets glossed over is how quickly the math inverts when two or three things go wrong at once: a vacancy, a rate adjustment, and a flat market. None of those events is unusual. Together, they can turn a "solid" deal into a property you cannot sell without writing a check.
The clients who navigate leveraged investing well tend to share one habit: they stress-test before they fall in love with a property. They run the numbers at 10% lower rent, 10% vacancy, and a 2-point rate increase before they make an offer. Most of the time, the deal still works. Occasionally, it does not — and that is exactly the point. Knowing that before you close is the difference between a calculated risk and an expensive lesson.
Virginia buyers have an advantage here: local market data is granular enough to make realistic assumptions. The mistake is using national averages when submarket data is available. A Beamsrealtygroup agent who knows Northern Virginia or Hampton Roads can tell you what vacancy actually looks like in a given zip code, which changes the stress test entirely.
Ready to model your next Virginia deal with a local expert?
Personalized deal modeling is where Beamsrealtygroup earns its keep for Virginia buyers and investors. Rather than handing you a generic spreadsheet, the team runs your specific property through leveraged and all-cash scenarios side by side, using real local comps and current lender terms. They also coordinate introductions to Virginia-based lenders and mortgage advisors so your financing structure matches your investment timeline from the start.

No pressure, no one-size-fits-all advice. If the numbers say all-cash makes more sense for your situation, that is what you will hear. Schedule a consultation with Beamsrealtygroup to get a clear picture of what leverage can and cannot do for your next Virginia transaction.
Useful sources and further reading
- Investor.gov — Leveraged Investing Strategies: The SEC's plain-language overview of how leverage magnifies risk; good starting point for any first-time investor.
- Investopedia — What Is Financial Leverage?: Covers leverage ratios, margin accounts, and the mechanics of debt-financed investing with worked examples.
- LegalClarity — Leverage in Real Estate: Detailed breakdown of cap rate vs. loan constant, DSCR thresholds, and common loan structures including bridge and hard-money.
- Deal Run — What Is Leverage in Real Estate?: Concise glossary entry with the core equity-amplification example and conservative LTV guidance.
- J.P. Morgan Private Bank — Using Leverage to Invest: Institutional perspective on time horizon, compounding, and when leverage is appropriate.
- Franklin Templeton — Negative Leverage in Commercial Real Estate: Explains how rising interest rates pushed loan constants above cap rates and created negative leverage conditions.
- Tacticares — Navigating Negative Leverage: Practitioner-focused guide on cash-on-cash modeling and avoiding blind spots in headline appreciation math.
- Bankrate — Underwater Mortgage: What to Do: Covers the structural trap of negative equity and options available to owners who cannot sell or refinance.
- ProInvestorHub — How to Use Leverage in Real Estate: Step-by-step cash-on-cash formula with a worked example; useful companion to the metrics section above.
- WLTH — How Leverage Builds Wealth Over Time: Explains the five-year-plus time horizon recommendation and how compounding interacts with principal paydown.
- Low-Risk Real Estate Investing Strategies: Practitioner perspective on conservative leverage in smaller markets; useful context for Virginia investors outside major metro areas.