
Neighborhood appreciation is defined as the sustained increase in property values driven by improving local conditions, demand, and investment activity. It is the single most powerful force behind long-term real estate investment returns. Neighborhood quality ranks as the top factor buyers consider when purchasing a home, outranking price, square footage, and school districts. That finding alone explains why neighborhood appreciation matters to investors: it directly controls buyer demand, rental income potential, vacancy rates, and how fast a property sells at full market value.
Why neighborhood appreciation matters for real estate investors
Appreciation in a neighborhood does more than raise a property's paper value. It compresses vacancy, accelerates sale timelines, and strengthens rent demand simultaneously. An investor holding a rental in a declining area faces the opposite on all three fronts, regardless of how well the property itself is maintained. The neighborhood is the investment context, and context determines outcome.
The industry term for this concept is locational value capture, which describes how improvements to a surrounding area translate into measurable gains for individual properties. Investors who understand locational value capture stop asking "Is this a good property?" and start asking "Is this a good neighborhood trajectory?" That shift in framing separates disciplined investors from speculators.
Neighborhood appreciation also affects liquidity directly. Rising demand makes properties easier to sell quickly and at expected market prices, reducing the holding risk that erodes returns on longer timelines. Liquidity is often the overlooked half of the return equation.

What are the measurable indicators of neighborhood appreciation?
Investors need concrete data points, not impressions. The clearest signals come from tracking two metrics together over 12–24 months: median price per square foot and Days on Market (DOM). Analyzing 12–24 months of sales data with rising median price per square foot combined with declining DOM confirms genuine demand growth. One metric alone can mislead. Both moving in the right direction simultaneously signals real appreciation momentum.
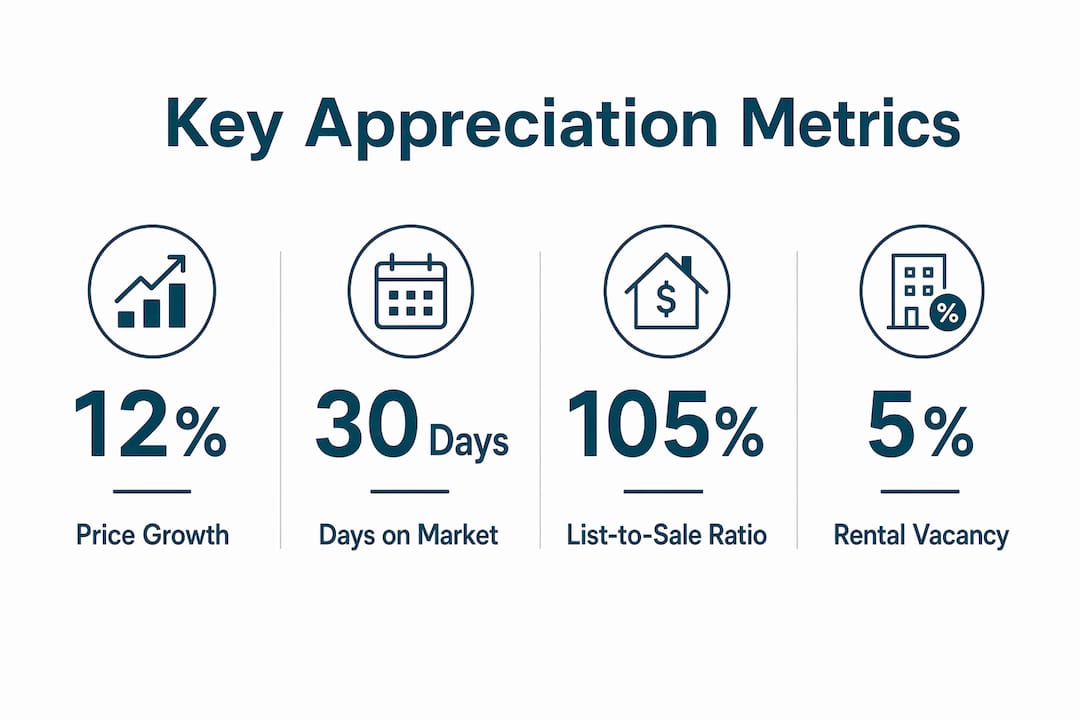
The list-to-sale price ratio adds a third layer of confirmation. When properties consistently close above list price, sellers hold negotiating power. That seller strength reflects a buyer pool that is growing faster than available inventory.
| Metric | What to track | What it signals |
|---|---|---|
| Median price per square foot | Rising trend over 12–24 months | Strengthening buyer demand |
| Days on Market (DOM) | Declining trend | Inventory absorption is accelerating |
| List-to-sale price ratio | Consistently above 100% | Seller market, competitive buyer pool |
| Rental vacancy rate | Falling below local average | Strong renter demand, income stability |
| New permit activity | Increasing residential and commercial permits | Developer confidence in the area |
Pro Tip: Cross-reference DOM trends with rental vacancy data. A neighborhood where both are falling is showing appreciation pressure from two directions at once, which is a much stronger signal than price data alone.
Investors who rely only on recent sale prices miss the timing advantage. By the time price appreciation shows up clearly in the data, the best entry points are often gone.
Do leading indicators matter more than past price growth?
Past price growth is a lagging indicator. It tells you what already happened. Zoning changes, transit development, and commercial infill typically precede price appreciation by 2–5 years. Investors who read those signals early capture the full appreciation curve. Investors who wait for price confirmation buy near the peak.
The leading indicators worth tracking include:
- Zoning reclassifications: Upzoning from single-family to mixed-use signals municipal intent to densify and attract commercial activity.
- Transit corridor announcements: New bus rapid transit lines or rail stops historically lift surrounding property values before construction even begins.
- Commercial infill activity: Coffee shops, grocery anchors, and fitness studios entering a neighborhood reflect consumer spending data that institutional investors have already analyzed.
- Building permit volume: Rising permit counts for both residential and commercial projects show developer confidence backed by capital.
- Municipal budget allocations: Infrastructure spending in a specific zip code signals that public capital is concentrating there.
Concentrated investment by municipalities or private interests is what generates measurable appreciation. Atlanta's $5 billion Neighborhood Reinvestment Initiative is a direct example of this principle at scale. Broad or unfocused investment strategies rarely move the needle on neighborhood values.
Pro Tip: File a public records request with your target city's planning department to pull active zoning applications and permit pipelines. This data is free, rarely analyzed by retail investors, and often 12–18 months ahead of what shows up in price comps.
Investors must underwrite deals on current rents and vacancy rates, treating future appreciation as upside potential rather than a financial requirement. Deals that only work if appreciation materializes are speculative positions, not investments.
How do community equity models strengthen neighborhood appreciation?
Community equity models are investment structures where local residents participate financially in neighborhood improvements alongside institutional capital. They matter to outside investors because resident participation changes neighborhood dynamics in ways that pure capital cannot replicate.
When locals have a financial stake in a neighborhood's success, they maintain properties more carefully, advocate for public improvements, and create the social stability that sustains long-term desirability. That behavior reduces the volatility that erodes returns for all investors in the area.
Chicago TREND's model is the clearest documented example. Small local investors in Chicago TREND earned roughly five times their initial investment, with $5,000 stakes generating $28,000 payouts after property sales. Those returns came from institutional-grade neighborhood improvements that local participation helped sustain.
"Involving local residents in investment through small-scale funding builds a more resilient neighborhood environment with stakeholders who maintain and improve properties, fostering stable appreciation over time."
Investors evaluating a neighborhood should look for signs of resident engagement: active neighborhood associations, locally owned businesses with long tenures, and community development financial institutions (CDFIs) operating in the area. These are signals that the social infrastructure supporting appreciation is already in place.
What practical steps should investors take to assess appreciation potential?
A disciplined neighborhood evaluation combines quantitative data with on-the-ground observation. The goal is to build a layered picture that no single data source can provide alone.
- Pull 12–24 months of sales comps. Focus on median price per square foot trends and DOM. Confirm the direction of both before drawing conclusions.
- Review crime trend data. Use city-level crime mapping tools to identify whether violent and property crime rates are falling. Declining crime is one of the strongest predictors of incoming buyer demand.
- Assess school quality trajectories. School ratings matter less than their direction. A district moving from a 5 to a 7 rating attracts a different buyer pool than one holding steady at a 9.
- Score walkability and transit access. Walk Score and transit access ratings correlate with rental demand and resale liquidity, particularly for younger buyer demographics.
- Analyze rental demand signals. Track average days to lease, concession trends, and asking rent growth in the submarket over the past 12 months.
- Map active development activity. Drive the neighborhood and cross-reference with permit data. Cranes and scaffolding confirm what the data suggests.
- Verify buyer composition. Neighborhoods dominated by speculative buyers carry higher resale risk than those with strong owner-occupant demand. Request buyer type breakdowns from a local title company or agent.
Pro Tip: Avoid the cosmetic improvement trap. Neighborhoods showing surface-level upgrades without strengthening rental demand or employment growth often disappoint investors when economic fundamentals fail to support price premiums. Always verify that visible improvements are backed by real demand drivers.
Weighting these factors depends on your investment objective. Cash flow investors should prioritize rental vacancy trends and employment base stability. Appreciation-focused investors should weight leading indicators like zoning changes and permit activity more heavily.
Key Takeaways
Neighborhood appreciation is the primary driver of long-term real estate investment returns, and investors who track leading indicators rather than lagging price data capture the most value.
| Point | Details |
|---|---|
| Appreciation drives liquidity | Rising neighborhood demand makes properties faster to sell at full market value, reducing holding risk. |
| Use leading indicators | Zoning changes, transit development, and permit activity precede price growth by 2–5 years. |
| Track two metrics together | Declining DOM combined with rising median price per square foot confirms genuine appreciation momentum. |
| Community equity adds resilience | Resident financial participation stabilizes neighborhoods and sustains long-term property value growth. |
| Underwrite on current fundamentals | Treat future appreciation as upside, not a requirement. Deals must work on today's rents and vacancy rates. |
Neighborhood appreciation as a systems problem, not a label
Most investors I talk with still think in binary terms: good neighborhood or bad neighborhood. That framing costs them money. Every neighborhood is a system, and systems change direction. The question is never "Is this a good area?" The question is "Which direction is this system moving, and what is driving it?"
I have watched investors overpay in "good" neighborhoods because they confused past appreciation with future potential. I have also watched disciplined investors buy in areas that looked rough on the surface but had three or four leading indicators pointing sharply upward. The second group consistently outperforms.
The other mistake I see regularly is ignoring the community dimension entirely. Investors who treat neighborhoods as passive backdrops miss the signal that resident engagement sends. A block where people know each other, maintain their properties, and show up to zoning meetings is a block that holds value through market cycles. That social cohesion does not show up in a spreadsheet, but it absolutely shows up in resale prices and vacancy rates.
Balancing appreciation potential with cash flow discipline is the hardest part of this work. Appreciation is real, but it is not guaranteed. The investors who build durable portfolios are the ones who never need appreciation to make a deal work. They treat it as a bonus, not a business plan.
— Myra
How Beamsrealtygroup supports neighborhood-focused investment decisions
Real estate investors who want to act on neighborhood appreciation trends need more than data. They need someone who can interpret what the data means for a specific property in a specific submarket.
Beamsrealtygroup brings deep market knowledge and hands-on experience to every investment evaluation. The team helps investors in Virginia identify neighborhoods with genuine appreciation momentum, assess leading indicators, and avoid the surface-level signals that lead to costly mistakes. Whether you are evaluating your first investment property or expanding an existing portfolio, Beamsrealtygroup's expert guidance connects the dots between neighborhood trends and real investment outcomes. The process is direct, data-grounded, and built around your specific goals.
FAQ
What is neighborhood appreciation in real estate?
Neighborhood appreciation is the increase in property values driven by improving local conditions, rising demand, and concentrated investment activity. It directly affects an investor's returns, rental income, and ability to sell at full market value.
What are the best indicators of neighborhood appreciation?
The clearest indicators are rising median price per square foot and declining Days on Market tracked together over 12–24 months. Leading signals like zoning changes and new transit infrastructure often precede measurable price growth by 2–5 years.
Why do leading indicators matter more than recent price growth?
Recent price growth is a lagging indicator that reflects what already happened. By the time appreciation is visible in sale prices, the best entry points are typically gone. Zoning changes, permit activity, and transit development signal appreciation before it shows up in comps.
How does community equity affect neighborhood investment returns?
Community equity models give local residents a financial stake in neighborhood improvements, which increases property maintenance and social stability. Chicago TREND's model produced roughly five-fold returns for small local investors, demonstrating that resident participation can amplify appreciation for all investors in the area.
How should investors balance appreciation potential with investment risk?
Investors should underwrite every deal based on current rents and vacancy rates, treating future appreciation as upside rather than a financial necessity. Deals that only work if appreciation materializes are speculative, not investment-grade positions.