
Neighborhood usually determines your long-term value and daily life more than the house itself. You can renovate a kitchen, add a bathroom, or repaint every room — but you cannot move the street, the school district, or the commute. Beamsrealtygroup works with buyers across Virginia who learn this the hard way when they prioritize square footage over location. A longitudinal MIDUS study found that perceived neighborhood quality is consistently linked to higher owner-assessed home values, with relative quality driving a ~19.72% increase in self-assessed value.
Three things to assess before you fall in love with any house:
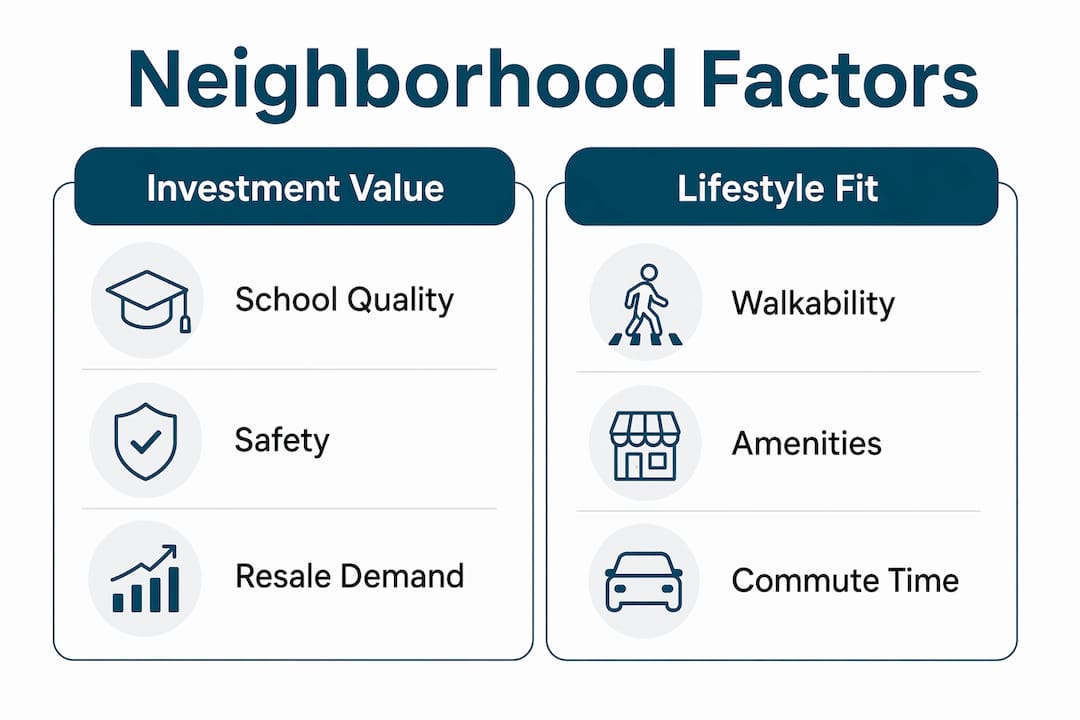
- Resale demand drivers: school district ratings, crime trends, and proximity to planned infrastructure
- Monthly and lifetime costs: property taxes, HOA fees, insurance premiums, and commuting expenses
- Lifestyle fit: walkability, amenity access, commute time, and community character
Table of Contents
- How does neighborhood quality affect home value and resale demand?
- What concrete factors should every buyer evaluate?
- How does your neighborhood choice change monthly and lifetime costs?
- How do you research and evaluate a neighborhood before making an offer?
- What are the real red flags versus negotiable trade-offs?
- How do you balance investment value against lifestyle fit?
- How long does neighborhood change and appreciation actually take?
- Key Takeaways
- The neighborhood question most buyers ask too late
- Beamsrealtygroup can help you evaluate any neighborhood before you offer
- Primary sources and recommended places to look for neighborhood data
How does neighborhood quality affect home value and resale demand?
Neighborhood quality shapes prices through a mechanism economists call location externalities: the value of surrounding conditions spills over onto individual properties whether owners want it to or not. A well-maintained park, a highly rated school, or a new transit line raises nearby land values. Persistent crime, industrial noise, or deteriorating infrastructure does the opposite.
The numbers back this up. The MIDUS longitudinal study found that a homeowner's perception of their neighborhood's quality relative to other neighborhoods drives a substantial increase in self-assessed home value. Meanwhile, an NBER working paper on urban revitalization found that housing externalities from nearby improvements fall by roughly half every 990 feet, and land prices in targeted revitalization areas rose annually above control neighborhoods.
Statistic to remember: Neighborhood quality perception alone accounts for a ~19.72% increase in owner-assessed home value (MIDUS), while proximity to revitalization projects adds a 2–5% annual land price appreciation (NBER).
The practical implication: the "worst house on a good block" strategy has real data behind it. A modest home in a high-demand neighborhood tends to outperform a pristine home in a declining area because the land and surrounding infrastructure are not renovatable.
| Neighborhood Signal | Typical Effect on Value |
|---|---|
| Top-rated school district | Sustained demand across market cycles |
| Active revitalization within 990 feet | 2–5% annual land price uplift above control areas |
| High relative perceived quality | ~19.72% increase in owner-assessed value |
| Rising crime trend | Downward pressure on resale demand and insurance costs |
What concrete factors should every buyer evaluate?
Location is the one variable you cannot change after closing. Practitioners consistently advise buyers to "buy the spot, not the space" — trading square footage for a better location almost always produces stronger long-term resale. Here are the factors that materially move the needle:
- School quality: Affects resale demand even if you have no children. Buyers in strong districts pay a premium, and that premium holds through down cycles.
- Safety and crime trends: Look at direction of change, not just current rates. A neighborhood with declining crime is a different investment than one with rising incidents.
- Walkability and transit: Proximity to walkable amenities and public transit raises land values and reduces car-dependency costs.
- Commute time and access: A 45-minute commute adds up to roughly 375 hours a year. Factor that into lifestyle math before you commit.
- Future development and zoning: Approved infrastructure projects can lift values; industrial rezoning or highway expansion can suppress them.
- Environmental and flood risk: FEMA flood zone designation affects insurance availability and cost, sometimes dramatically.
- Neighborhood upkeep: Visible maintenance signals community investment and correlates with stable or rising values.
Pro Tip: Even if you have no kids and never plan to, buy in a strong school district. Future buyers will, and that sustained demand protects your resale price through soft markets.
How does your neighborhood choice change monthly and lifetime costs?
Two homes listed at the same price can carry very different monthly costs depending on where they sit. Property taxes, HOA fees, insurance premiums, and commuting are all neighborhood-driven expenses that your mortgage calculator will not show you automatically.

Consider a simplified comparison between two hypothetical Virginia neighborhoods at the same $450,000 list price:
| Cost Category | Neighborhood A (urban, walkable) | Neighborhood B (suburban, car-dependent) |
|---|---|---|
| Monthly delta | — | +$640/month higher |
Over a 10-year hold, that $640 monthly gap compounds to more than $76,000 in additional costs — before accounting for any difference in appreciation rates.
Where to get the actual numbers: your county assessor's website for tax rates, the HOA disclosure documents required at contract, state-licensed insurance brokers for premium quotes, and FEMA's flood map portal for zone designations.
How do you research and evaluate a neighborhood before making an offer?
The recommended sequence: gather online data first, then make phone calls, then visit in person at multiple times, then score and decide.
- Define your priorities. Rank the factors above (schools, commute, safety, costs, lifestyle) by personal weight before you look at any specific neighborhood.
- Run online data checks. Pull crime trend data from local police department portals or the FBI's Uniform Crime Reporting data, school ratings from your state's education department site, and recent sales history from your county assessor.
- Check municipal and planning portals. Review county zoning maps and planning commission agendas for approved or pending projects near the property.
- Pull FEMA flood maps. Enter the address at msc.fema.gov to confirm flood zone designation before requesting insurance quotes.
- Get insurance and tax quotes. Contact at least two insurers with the specific address and flood zone. Pull the current tax bill from the county assessor, not the listing sheet.
- Visit at different times. Go on a weekday morning, a weekday evening, and a weekend afternoon. Traffic patterns, noise levels, and street activity look very different at 8 AM versus 9 PM.
- Score and decide. Use a simple weighted grid: assign each priority a weight (1–5) and rate the neighborhood on each factor (1–5). Multiply and sum. Compare scores across neighborhoods, not just gut feelings.
| Priority Factor | Your Weight (1–5) | Neighborhood Score (1–5) | Weighted Score |
|---|---|---|---|
| School district | 5 | 4 | — |
| Safety trend | 4 | 3 | — |
| Commute time | 3 | 5 | — |
| Flood/insurance risk | 4 | 4 | — |
| Walkability | 2 | 3 | 6 |
What are the real red flags versus negotiable trade-offs?
Not every neighborhood concern is a deal-breaker. The key is distinguishing problems that are structural and permanent from ones that are cosmetic or temporary.
Walk away when you see: a multi-year upward crime trend with no visible community response; a confirmed infrastructure project (highway, industrial facility) that permanently reduces livability; a FEMA Special Flood Hazard Area designation with no affordable insurance available; or a sustained price decline over three or more years with rising days-on-market.
Negotiable trade-offs look different. Short-term construction nearby is disruptive but finite. A below-market comp caused by a single distressed sale is not a trend. A neighborhood in early-stage revitalization with confirmed municipal investment may carry short-term friction but long-term upside.
When trade-offs exist, use them at the negotiating table. A flood zone designation, a noisy arterial road, or a dated HVAC system are all grounds for a price concession or a contingency condition — not automatic reasons to walk.
How do you balance investment value against lifestyle fit?
Both matter. The right balance depends on your time horizon and what you actually need day to day.
A buyer with a 7–10 year horizon and strong appreciation signals in a neighborhood can rationally accept a longer commute or fewer walkable amenities. The math often works out. A buyer who works from home, has young children, or prioritizes daily convenience may find that a lifestyle-first pick in a stable but slower-appreciating neighborhood produces more satisfaction — and fewer regrets — over the same period. Neither choice is wrong; the error is optimizing for one without honestly accounting for the other.
Location drives pricing in ways that compound over time, so even lifestyle-first buyers should set a floor on investment fundamentals: avoid neighborhoods with declining school ratings, rising crime, or no near-term development catalyst.
Pro Tip: Set a hard budget ceiling for combined commuting and housing costs as a percentage of your take-home pay. If a "better" neighborhood pushes that ceiling, the lifestyle math may not actually work in your favor.
How long does neighborhood change and appreciation actually take?
Neighborhood-driven appreciation is measured in years, not months. The NBER revitalization research tracked housing externalities from 1999 to 2004 and found that land price uplifts of 2–5% annually above control neighborhoods accumulated over a multi-year period, with effects decaying sharply beyond 990 feet from the improvement.
Key finding: The MIDUS study's ~19.72% value premium tied to relative neighborhood quality reflects a perception effect that builds as a neighborhood's reputation solidifies — not an overnight shift.
For short-term buyers (under 3 years), neighborhood trajectory matters less than current fundamentals: strong schools, low crime, and low carrying costs. For buyers with a 5–10 year horizon, early-stage revitalization signals — confirmed transit investment, new commercial development, rising permit activity — can represent meaningful upside if the externality effect compounds at even the lower end of the NBER range.
Key Takeaways
Neighborhood choice shapes long-term home value, monthly costs, and daily quality of life more than any single feature inside the house.
| Point | Details |
|---|---|
| Perception drives value | MIDUS research links relative neighborhood quality to a ~19.72% increase in owner-assessed home value. |
| Proximity to improvements matters | NBER data shows land prices rise 2–5% annually near revitalization, with effects halving every 990 feet. |
| Hidden costs add up fast | Property taxes, HOA fees, insurance, and commuting can create a $640+/month gap between similarly priced homes. |
| Red flags vs. trade-offs | Rising crime trends and uninsurable flood risk are deal-breakers; short-term construction and below-market comps are negotiating tools. |
| Beamsrealtygroup's role | Beamsrealtygroup helps Virginia buyers run neighborhood scoring, pull local comps, and flag cost and risk factors before an offer. |
The neighborhood question most buyers ask too late
Most buyers spend more time picking countertop finishes than evaluating the street they will live on for the next decade. That is not a criticism — it is just how the process feels when you are emotionally invested in a house. But the research is clear: the neighborhood's relative quality, its trajectory, and its cost structure will shape your financial outcome and your daily experience far more than the finishes ever will.
What I find buyers consistently underestimate is the direction of change. A neighborhood does not need to be perfect today. It needs to be moving in the right direction, with confirmed investment signals — a new transit stop, a rezoned commercial corridor, a declining crime trend — that compound over the years you plan to hold. A flat or declining trajectory in an already weak area is the scenario that produces regret, not a modest house in a strong zip code.
The scoring grid in this article is not a gimmick. Buyers who weight their priorities before they tour a neighborhood make cleaner decisions and negotiate harder. They also call less often six months after closing.
Beamsrealtygroup can help you evaluate any neighborhood before you offer
Choosing the right neighborhood is the highest-stakes decision in a home purchase, and it is also the one where most buyers have the least data. Beamsrealtygroup gives Virginia buyers a concrete edge: local market comps pulled by address, school district analysis, property tax and insurance guidance, and a review of municipal planning activity near any property you are considering.
The team at Beamsrealtygroup runs neighborhood checks as a standard part of the buying process — not an add-on. You get the data you need to score a neighborhood honestly, spot cost surprises before they hit your budget, and negotiate from a position of knowledge rather than hope.
- Custom neighborhood scoring based on your priorities
- Local comparable sales and appreciation trend analysis
- School district and zoning review
- Property tax and insurance cost guidance
- Municipal planning and development flag review
Ready to evaluate your next neighborhood with real data behind you? Connect with Beamsrealtygroup to get started.
Primary sources and recommended places to look for neighborhood data
Studies cited in this article:
- MIDUS Longitudinal Study — Adjacency Neighborhood Effects and Owner-Assessed Home Values: National longitudinal survey linking perceived neighborhood quality to self-assessed home values, with quantified estimates for relative quality and neighbor interaction effects.
- NBER Working Paper W14369 — Urban Revitalization Externalities: Tracks housing price externalities from revitalization projects (1999–2004), including distance-decay rates and annual land price differentials.
Practical data sources to check:
- County assessor website: Current property tax rates and recent sales history by address
- FEMA Flood Map Service Center (msc.fema.gov): Flood zone designation for any U.S. address
- FBI Uniform Crime Reporting (ucr.fbi.gov): Crime trend data by jurisdiction
- State department of education portal: School ratings, test scores, and district boundaries
- Local police department crime map: Address-level incident data and trend direction
- County planning commission portal: Approved and pending zoning changes, infrastructure projects, and development permits
Check trend data over at least three years, not a single snapshot. Municipal planning portals often publish meeting agendas and approved project lists that reveal what is coming to a neighborhood before it shows up in any listing description.